FEATURES

Everything rate-related, in one place.

Six purpose-built tools covering the full Medicaid rate intelligence workflow — from lookup to alert to AI query.

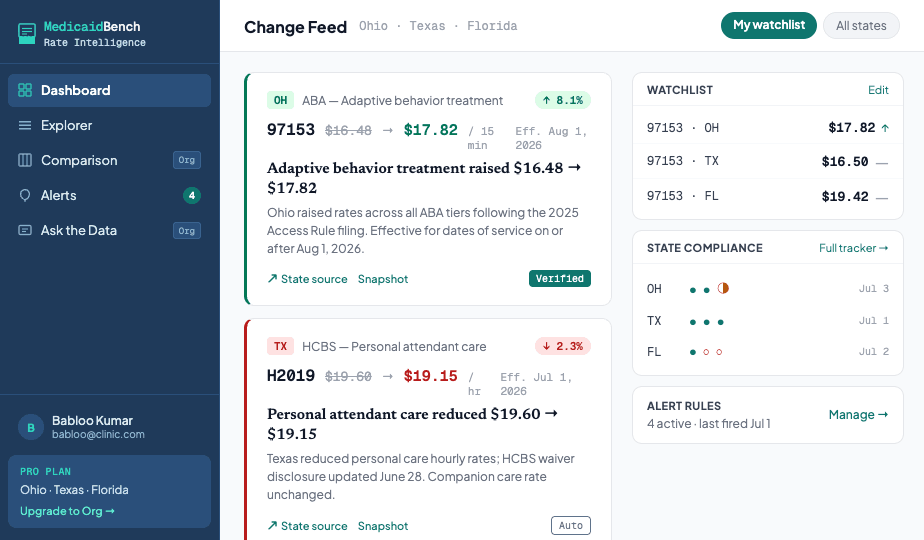
CHANGE DASHBOARD

See every rate move, the moment it happens.

Your personalized change feed surfaces rate changes across your watched states and codes — with verified source links, effective dates, and plain-English summaries of what moved and why. Track state compliance status at a glance.

  • Personalized watchlist for your key codes
  • State compliance tracker with deadline dates
  • Verified source link on every change
  • Auto and manual alert rule indicators
Available on all plans
Change Dashboard
Rate Explorer
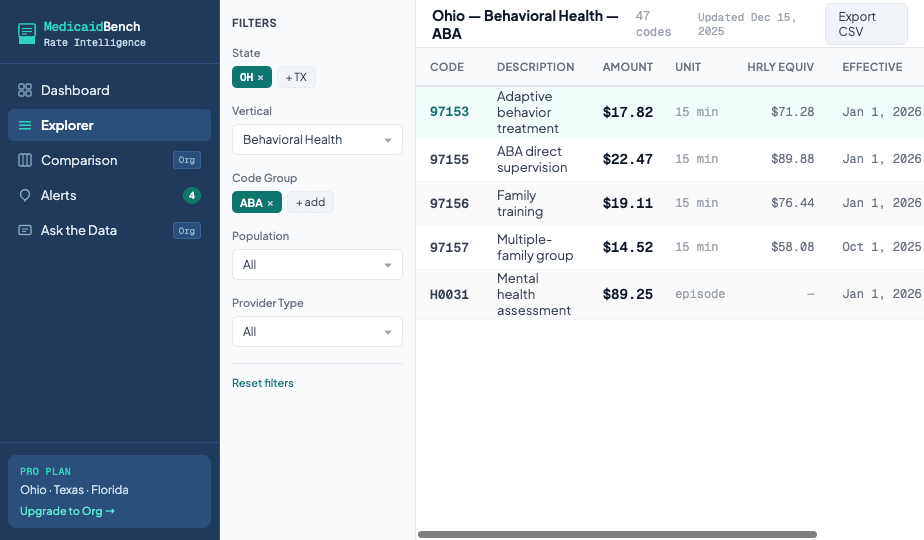
RATE EXPLORER

Filter 50 states by code, vertical, and population.

Slice the full fee schedule by state, procedure code, service vertical, provider type, and population. Every row shows the effective date, unit type, hourly equivalent, and a direct link to the official source document.

  • All 50 states, continuously updated
  • Source provenance on every row
  • Hourly equivalent auto-calculated
  • One-click CSV export
Available on all plans
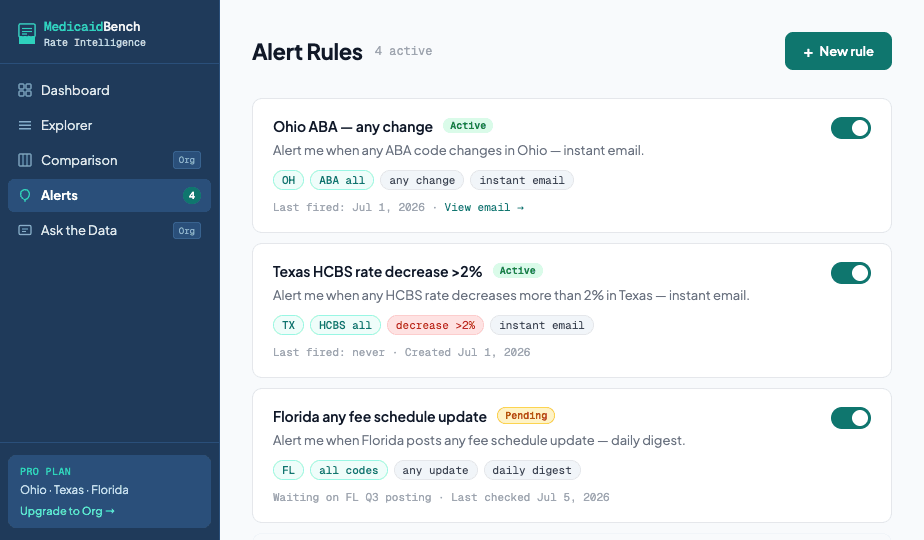
SMART ALERTS

Know the moment a rate moves.

Build precise alert rules — state, code group, change direction, percentage threshold — and get notified the moment a matching change is published. Instant email or daily digest. No more manually refreshing fee schedule PDFs.

  • Threshold conditions (e.g. decrease >2%)
  • Instant email or daily digest delivery
  • Unlimited alert rules
  • Full audit trail of all fired alerts
Pro, Org & Enterprise
Smart Alerts
Ask the Data
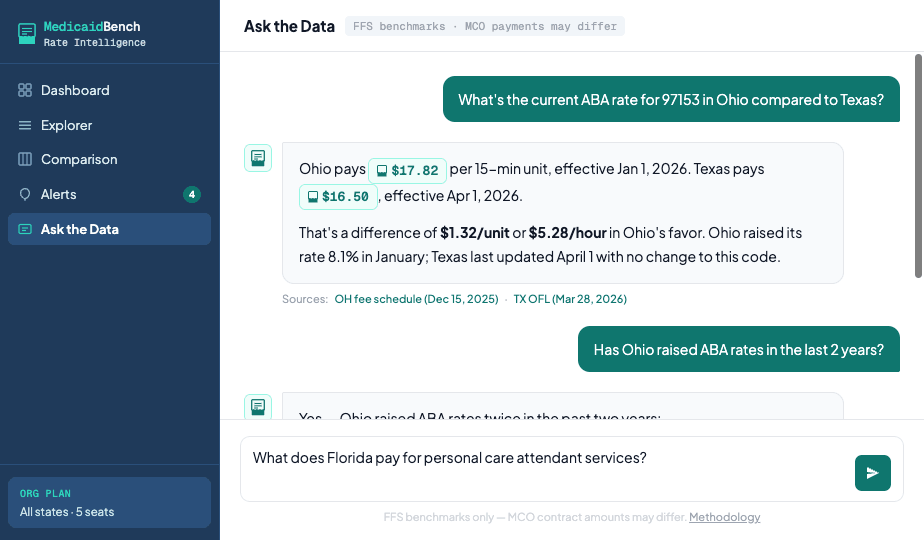
ASK THE DATA

Query in plain English. Get cited answers.

Ask questions like "What does Ohio pay for ABA code 97153 compared to Texas?" and get structured answers with inline source citations. Every number is traceable to an official document. No SQL, no spreadsheet gymnastics.

  • Natural language queries
  • Inline source citations on every answer
  • Cross-state comparisons in seconds
  • Rate chips with context and delta
Org & Enterprise
COMPARISON GRID · ORG & ENTERPRISE

Cross-state rate matrix, ranked and heat-mapped.

Compare any procedure code across multiple states simultaneously. Sort and rank by rate, delta, or effective date. Color-coded heat tint makes outliers instantly visible — no pivot table required.

  • Multi-state, multi-code matrix
  • Heat-tint outlier highlighting
  • Shared across team seats

Try every feature free for 14 days.

No credit card required. Cancel anytime.